Celtic countries : EU election detail (2)

Between 4-7 June 2009, registered voters in the European Union's 27 Member States went to the polls to decide who their European representatives would be for the next five years by the largest trans-national democratic electorate in the world.
Cornwall, Scotland (North of Ireland) and Wales went to the polls on 4th June, Ireland on 5th June and Brittany on 7th June. With the exception of Brittany all of the state parties suffered as a consequence of a voting shift.
In the UK, Wales and Scotland the Members of the European Parliament (MEP's) elected will represent the whole of the country, Brittany is represented by a `Ouest' constituency and Cornwall is represented by the South West of England (which includes Gibralter).
In Cornwall, Mebyon kernow – the Party for Cornwall won their highest percentage of votes, beating their own record of 10 000 votes gained by Richard Jenkin in 1979 and putting them ahead of the UK Labour Party by over 3 000 votes.
In Wales and Scotland too, Labour were mauled at the elections, with Plaid retaining their one MEP, Jill Evans, and the Scottish Nationalist Party (SNP) retaining their previous two members, Alyn Smith and Ian Hudgeton. The SNP had the largest share of the vote with 29% - nearly 10% ahead of Labour - and it is the first time the SNP has topped the poll in a European election in Scotland.
In Wales, Labour was beaten by the Conservatives for the first time in any popular vote since 1918, but the Plaid vote fell behind that of Labour, even though exist polls before the election put Plaid out in the lead. Plaid nevertheless increased their share of the vote by 1.1% and ended only 19,000 votes off the top spot, but ended up a disappointing third.
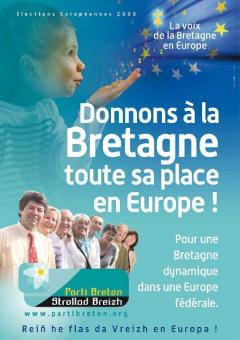
In Brittany, the party of President Sarkozy of France, UMP, came out on top, with Europe Ecologie (EE) coming second. The Europe Ecologie list was made up of a mixture of green and nationalist party candidates throughout the state of France. EE were supported by the UDB in Brittany and one of its political allies, François Alfonsi, from the PNC (Corsica) and number two on the Europe Ecologie list, was elected. The deal is that Alfonsi will represent the interests of the nationalist parties that make up the organisation known as Régions and Peuples Solidaires, which includes the UDB.
In Ireland the ruling Fianna Fáil (FF) party suffered heavy losses and gained just 23% of the national vote. The Greens, who are in a coalition government with the FF, were by far the biggest loosers and lost all ten of its councillors in Greater Dublin and didn't gain any European seats. Sinn Féin also suffered a major setback after its vice-president, Mary Lou McDonald, failed to retake her seat. Turnout of voters in the north of Ireland was 42.81%, 9% down on the election five years ago, but it is thought that more republican voters came out to vote than unionists.
It is estimated that participation in the European Elections slumped to 43 per cent, the lowest level since European elections began 30 years ago in 1979, as 213 million out of 375 million voters across the EU stayed at home.
The results of the European Elections for the Celtic countries that participated can be found below:
Alba (Scotland):
SNP 29.1% Labour 20.8% Tories on 16.8% Liberal Democrats 11.5% Greens 7.3% UK Independence Party (Ukip) 5.2% BNP 2.5%
Breizh (Brittany):
UMP: 26,71% Europe Ecologie: 17,94% Parti Socialiste: 17,70% Mouvement Démocrate: 9,71% Libertas: 5,64% NPA: 5,40% Front de Gauche: 5,02% Alliance Ecologiste Indépendante: 3,50% Front National: 3,04% Parti Breton: 2,82% Lutte Ouvrière: 1,28%
Eire
FG Fine Gael 29.13 FF : Fianna Fáil 24.08 Lab. : Labour Party 13.92 GP : Green Party 1.89 SF : Sinn Féin 11.28 Libertas : Libertas 5.62 SP : Socialist Party 2.76 Ind : Independent 11.36
(North of Ireland:
Sinn Fein 26% Democratic Unionist Party 18.2% Ulster Conservatives and Unionists - New Force 17.1% Social Democratic and Labour Party16.2% Traditional Unionist Voice 13.7% Alliance Party 5.5% Green Party 3.3%)
Kernow (Cornwall):
Conservative Party 46,589 UKIP 39,954 Liberal Democrats 29,436 Green Party 13,361 Mebyon Kernow 11,534 Labour Party 8,483 BNP 5,118
(Kernow in the South West of England context:
Conservatives 30.2% UK Independence Party 22.1% Liberal Democrats 17.2% Green Party: 9.3 % Labour Party 7.7% British Nationalist Party 3.9% Mebyon Kernow (MK) 1%)
Cymru (Wales):
Conservative 21.2% Labour 20.3% Plaid Cymru 18.5% UK Independence Party 12.8% Liberal Democrats 10.7% Green Party 5.6% British National Party 5.4%
Links
Régions & Peuples Solidaires (voir le site)
Europe Ecologie (voir le site)
(Article compiled for Celtic News by Rhisiart Tal-e-bot)
J B Moffatt Director of Information Celtic League
10/06/09
■